
Ratios and the rating
A banker reads ratios first. Fiplan calculates them from the plan's income statement and balance sheet, compares them with thresholds, and sums up the whole with a score out of 100, translated into letters.
What it is for
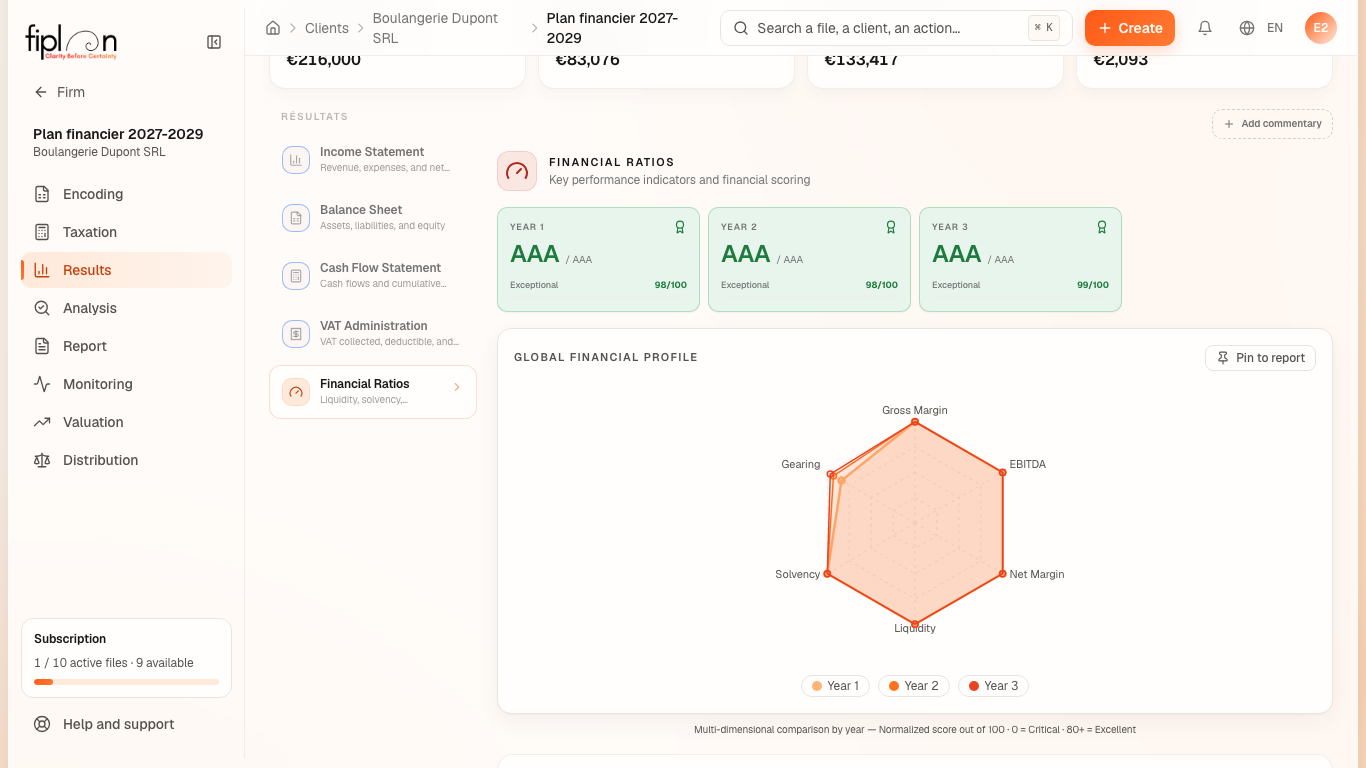
The Financial Ratios tab shows one card per financial year — the rating, its meaning and the score out of 100 —, a Global Financial Profile radar chart, then four expandable categories: Profitability, Liquidity, Solvency and WCR & Activity. Each value carries a coloured dot: meets standards, to monitor, or action required.
Steps
- Open Results, Financial Ratios tab.
- Read the rating of each financial year and its meaning.
- Expand a category: each ratio, its value for each financial year, its rating and its trend.
- Hover over a value to read its status, or the reason for an “N/A”.
- Open the Rating Scale for the score → letter correspondence.
Worked example · Boulangerie Dupont SRL
The 2027 ratios, as the screen displays them:
| Ratio | Calculation | 2027 |
|---|---|---|
| Gross Margin | gross margin ÷ revenue | 69.3% |
| EBITDA Margin | EBITDA ÷ revenue | 51.4% |
| Net Margin | net result ÷ revenue | 38.5% |
| ROE | net result ÷ equity | 80.6% |
| Current Ratio | current assets ÷ short-term debt | 3.99× |
| Solvency | equity ÷ balance sheet total | 63.3% |
| Gearing | financial debt ÷ equity | 0.32× |
| Repayment Capacity | EBITDA ÷ financial debt | 3.33× |
| Staff Cost Ratio | remuneration ÷ revenue | 17.9% |
| Average Stock Days | closing stock ÷ (supplies ÷ days in the financial year) | 16 j |
The 2027 score is 98 / 100, which gives the rating AAA: 95 and above gives AAA.
Pitfalls
What it changes · 2027
Source
Fiplan convention (financial-ratios.ts, working-capital.ts): the formulas, the thresholds (good, to monitor) and the rating scale (95 and above: AAA; 85: AA; 75: A; 65: BBB; 55: BB; 45: B; 35: CCC; 25: CC; 15: C; below: D) are those of the code. The score is the average of the ratings of the ratios that have thresholds, excluding “N/A”.